
3/11/17 – Combo Post – Storm Update & How I read computer models…
Before we start:
- I’ve been wanting to post a guide for a while and I figured with the upcoming major snowstorm, it would be a great opportunity to kill two birds with one stone. This post will utilize current computer model data for Tuesday’s storm and look at it from an instructional standpoint. My goal with this post is to show my methods for understanding weather computer models for the average person…keeping it as non-technical as possible.
- I am not a meteorologist. I do this for fun…a real meteorologist would probably tell you that there is a lot more that goes into it than this, but this works for my purposes. Information provided here is largely my opinion based on personal experience.
What are the models saying?
Quite often, TV meteorologists talk about computer models when forecasting weather. There are quite a few computer models out there…some more highly regarded and accurate than others. The three most commonly referenced models are the GFS (Global Forecast System), NAM (North American Model), and “Euro” (ECMWF). Let’s take a minute to summarize each one:
- GFS – US-based. Forecasts weather 16 days out. More accurate between 2-6 days from the start of a storm. Freely available.
- NAM – US-based. Forecasts weather 84 hours out. More accurate inside of 60 hours. Take anything over that with a grain of salt. Freely available.
- ECMWF – European-based. Forecasts weather about 10 days out. Statistically the most accurate model. More accurate in the 2-7 day range. Only partially freely available…(maps that show precipitation are subscription-based, and it’s not cheap. Available from several commercial sites and with an Accuweather Professional subscription. I used to have an Accuweather Pro subscription for free for three years because I helped their webmaster resolve some issues. It was cool while it lasted but I can’t justify the cost for myself at this time.)
How do I find this stuff and how do I understand it?
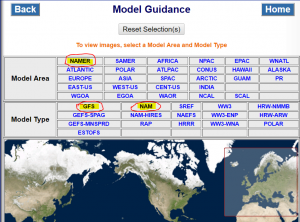 I will be using the GFS and NAM as a reference point for the remainder of this guide. Both can be found at the National Weather Service NCEP website. There are a plethora of options to choose from so I’m going to keep it simple. The picture on the left is a screenshot of the page…I’ve highlighted the areas relevant to this discussion. Click NAMER from the Model Area section and then select either GFS or NAM from the Model Type section. This will load a new page.
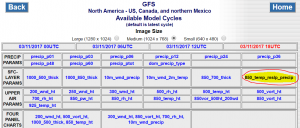 I will be referring to the GFS for this example. The GFS runs four times every day. This is all based on UTC time. (Take the time shown in UTC time and subtract 5 hours to get Eastern Standard Time, or four hours once Daylight Saving Time begins tonight. Once the next page loads, click 850_temp_mslp_precip. This will expand the table with a bunch of numbers. Just click loop all from the right hand side of the new table that opens. This will load a series of images showing computer model data for the next 16 days. This may take a bit depending on your internet connection. You can control the animation with the bar at the top of the map, or use your right and left arrow keys on your keyboard to manually go forward or backward. The first few days will show North American weather in hourly intervals. The next screen shot will detail how I read the maps. Scroll down below the large picture below for explanations.
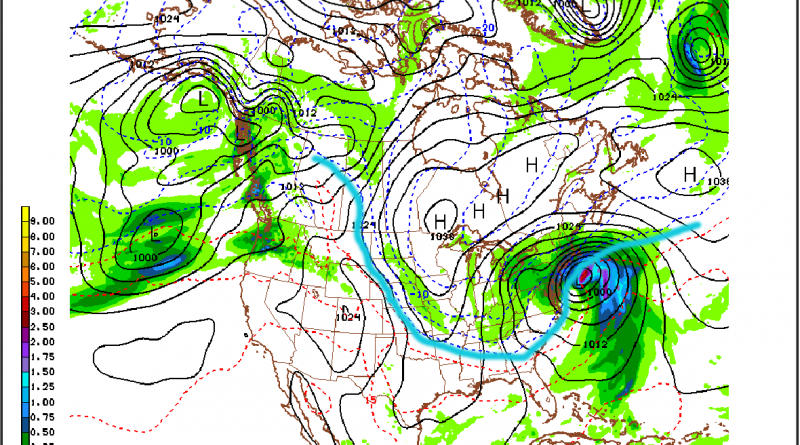
- Take note of the areas I circled in pink at the top of the map. The first area is the time the map was published…in this case 18UTC (this will stay the same in every frame of the animation). The second pink circle shows the time that the map is forecasting for (this obviously changes every frame). In the frame above, 16UTC is Noon Tuesday (subtracting 4 hours for Daylight Saving Time).
- These maps show the forecast amount of precipitation for a 6 hour window. You can see the intensity of the precipitation by comparing to the color key on the left hand side of the map.
- This map shows all precipitation and does not specify rain versus snow.
- The southernmost blue line (I’ve highlighted it in teal above) is generally a good indicator of the freezing line. (As I said before, real meteorologists would tell you that is not necessarily true, but for the average non scientist, it will do.) A good rule of thumb…From the perspective of someone living in PA, or on the east coast, areas North and West of this line are generally going to be getting snow. If you are right on or near the line, this is where mixed precipitation can be found and that is determined by many more factors. Areas South and East of the southernmost blue line are generally getting rain.
- The black lines are called isobars. They are lines of equal pressure. When they are very close together, expect strong winds.
- Winds rotate counterclockwise around Low Pressure areas (designated with an L) and clockwise around High Pressure areas (designated with an H).
- The numbers in black near the isobars are the atmospheric pressure readings. Lower pressure = stronger storm.
Okay I know how to read the models…now what?
- Do not look at model data as scientific fact.
- Look for trends…Does a storm show up on multiple consecutive model runs and on multiple different models? If so, chances are pretty good that it’s going to happen.
- Please feel free to ask any questions…If you would like something clarified/explained further, please let me know!
So what does this all mean for this storm?
- The model pictured above is the most current GFS and both it and the Euro are showing the storm positioned further East than previous model runs.
- This is causing a lot of snow lovers to freak out because they literally hug every run of the models. (If you want to experience negativity, head on over to some weather forums right about now…just make sure you wear a life preserver so you don’t drown in the tears of all the ‘model huggers’ complaining about a storm that’s not coming to their backyard).
- The NAM is now inside its window of accuracy and is showing a massive hit for the entire Eastern half of PA with crippling amounts from New Jersey, NY, up into New England.
What do I think will happen? (This is subject to change, but here goes)
- This storm will be caused by two storms merging into one.
- One will drop down out of the midwest and rapidly intensify as it merges with/transfers energy to a moisture rich storm off the coast of the DelMarVa peninsula.
- The sooner this merge occurs, the more powerful the storm and the greater chance for crippling snows throughout the Northeast.
- Despite the sadness of snow lovers on the weather forums and those jumping ship saying the storm is going East, I think the storm will actually come further west than the current GFS and Euro show, but a little bit east of where the NAM currently has it.
- If you live ANYWHERE in PA, 6-12 inches of snow is a virtual certainty.
- If you live in the Poconos or anywhere along and East of I-81, 10-18 inches of snow is a really good bet. Some locations in the affected area will get up to 24 inches.
- DC, Philly, Baltimore – at the very least, you will have heavy rain quickly changing to snow as the storm intensifies and temperatures crash.
That about sums it up in its current state. As always, feel free to ask questions on the Facebook page. Thanks for reading!